
Featured Maps
Explore maps created by our community

Spread of Christianity, 30–2025
by chrisjager · 7 polygons
29views0likes

Life expectancy in Europe, 1945–2024
by chrisjager · 2661 polygons
24views0likes

Beschermde diersoorten in Nederland, 1880–2026
by chrisjager · 29 polygons
0views0likes

How the Netherlands Rose from the Sea, 500 BC–2026
by chrisjager · 28 polygons
30views0likes

Mills Against the Water: Windmills, Pumping Stations and Floods in the Netherlands, 1400–2026
by chrisjager · 84 polygons
4views0likes

Who came first where: Tweede Kamer elections by gemeente, 1937–2025
by chrisjager · 40 polygons
5views0likes
Most liked
The maps visitors liked best

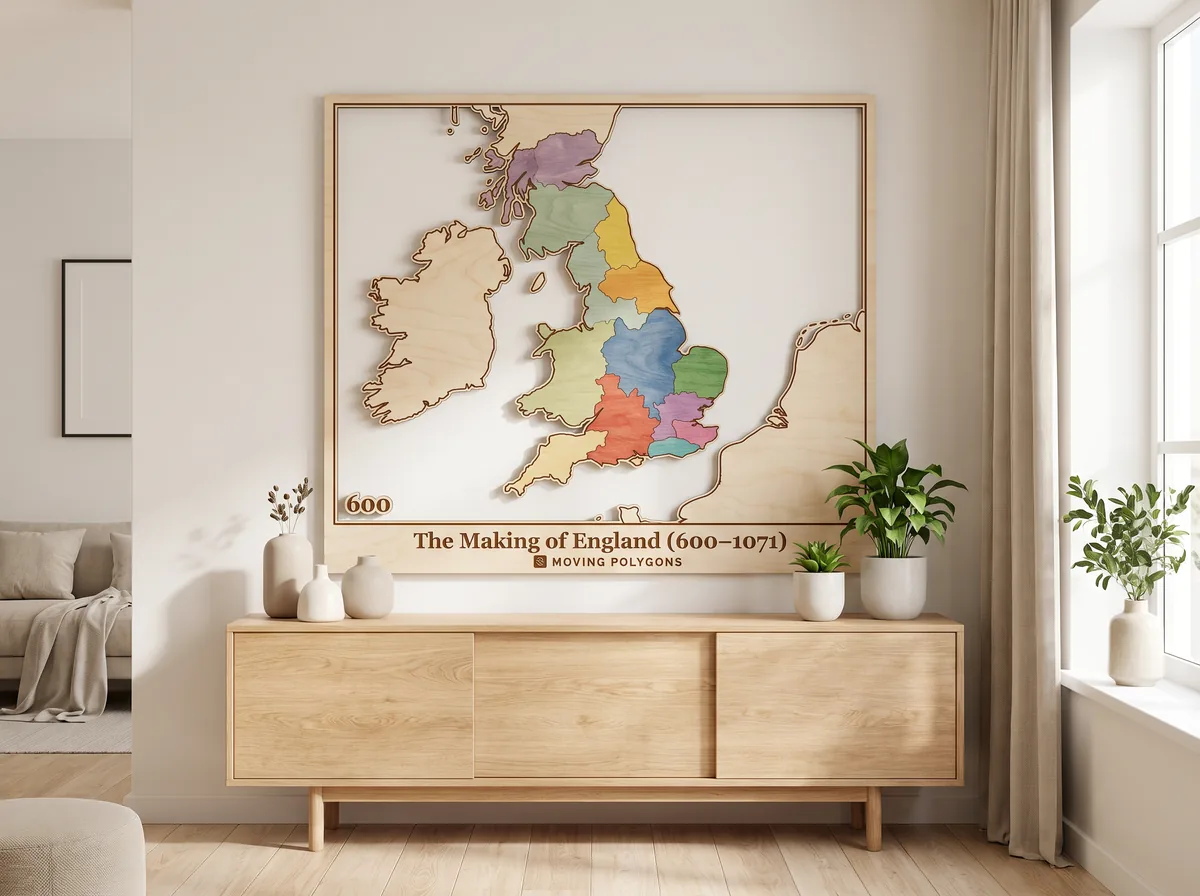
The Making of England (600–1071)
by chrisjager · 21 polygons
1kviews1likes

The spread of the Asian hornet across Europe, 2004–2026
by chrisjager · 23 polygons
924views1likes

The Rings of Power: Seasons 1–2 on a map of Middle-earth
by chrisjager · 88 polygons
561views1likes

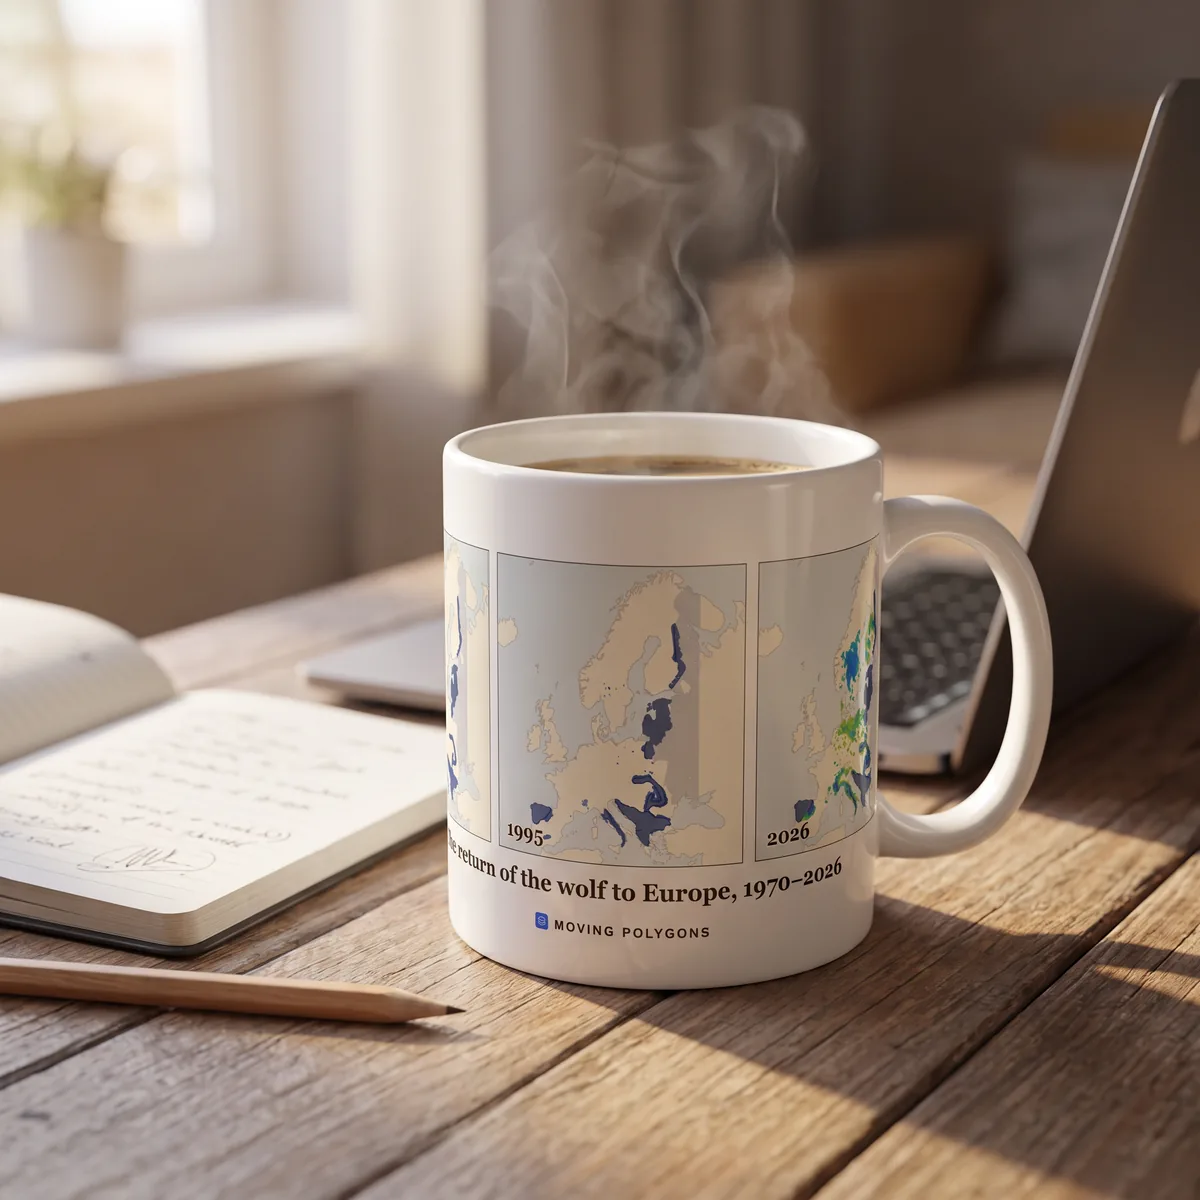
The return of the wolf to Europe, 1970–2026
by chrisjager · 33 polygons
202views1likes
Moving Polygons shopComing soon
Your favourite map, on the wall
Posters, mugs, shirts, a laser-cut wooden map and a jigsaw puzzle, printed with the maps on this site. Tell us what you'd buy and we'll let you know when it's ready.
See the shop
Interactive Maps
Draw polygons directly on the map with intuitive click-and-drag tools. Edit nodes, split edges, and reshape territories with ease.
Timeline Animation
Add timestamps to your polygons and watch them morph smoothly between states. Control playback speed and loop animations.
Share & Embed
Publish your maps to share with the world. Each map gets a unique URL that's perfect for sharing on social media or embedding in websites.
Built for Every Industry
From policy analysis to urban planning, animated maps help teams communicate geographic change with clarity and impact.
Historical Maps & Territory Visualization
Bring history to life with animated maps that show how borders, empires, and territories evolved across centuries.
Economic Policy & Trade Zone Mapping
Visualize the shifting boundaries of trade agreements, economic zones, and sanctions over time.
Urban Planning & Land Use Analysis
Track zoning changes, urban sprawl, infrastructure growth, and redevelopment areas with animated geographic overlays.
Climate & Environmental Change Monitoring
Map deforestation, coastline erosion, ice sheet retreat, wildfire spread, and habitat loss as they unfold over time.
Electoral & Political Boundary Mapping
Visualize redistricting, election results, constituency changes, and political boundary shifts across election cycles.
Business Intelligence & Market Expansion
Map franchise growth, retail footprint expansion, service area coverage, and competitive landscape changes over time.
Public Health & Epidemiological Mapping
Track disease spread patterns, vaccination coverage, healthcare access zones, and pandemic response boundaries as they evolve.
Geopolitics & Defense Intelligence
Visualize conflict zones, territorial disputes, military alliances, and sphere-of-influence changes over time.
Education & Academic Research
Create interactive teaching materials and research visualizations that show geographic change for classroom instruction, lectures, and publication.